Multi Pi-hole
Manage multiple Pi-hole instances from a single card.
What gets combined
Dashboard statistics are automatically combined across all configured Pi-holes.
The default (aggregation.mode: load_balanced) is:
- Total DNS Queries: sum
- Queries Blocked: sum
- Block Percentage: recalculated from combined totals ((total_blocked / total_queries) × 100)
- Domains on Blocklists: sum
- Active Clients: sum of unique clients across all instances (as exposed by the integration)
If every Pi-hole has the same blocklists, summing Domains on Blocklists
multiplies the real list size by the number of nodes. Set
aggregation.mode: mirrored to show the integer average for that tile while
keeping every other tile (including Active Clients) unchanged. See
Aggregation modes for full details and examples.
What is shown from the “first” Pi-hole
Some sections show data from the first Pi-hole instance (for example, additional metrics and system charts), while switches/actions are shown for all instances.
Status
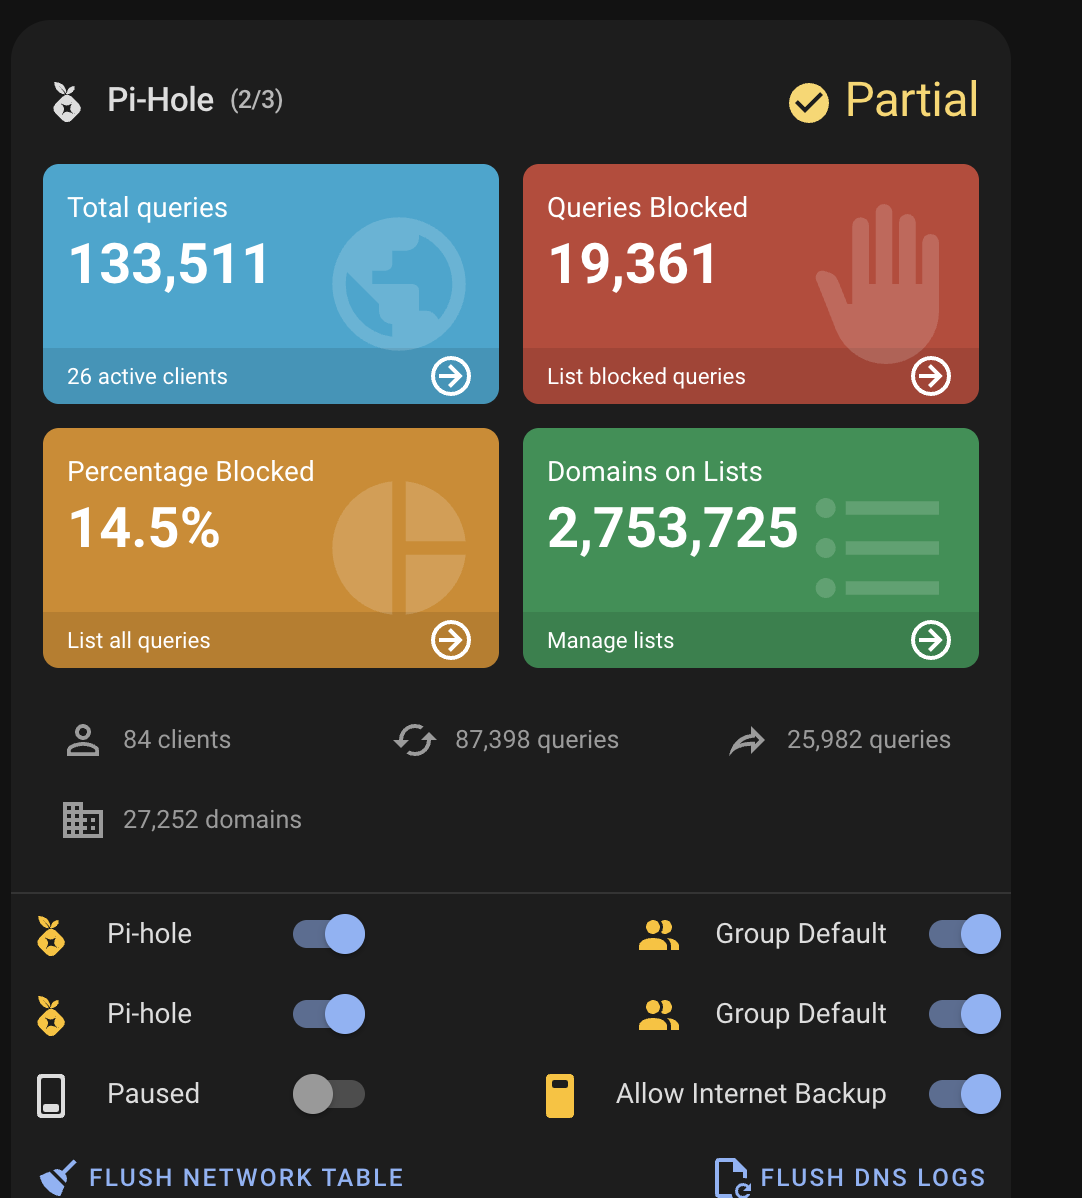
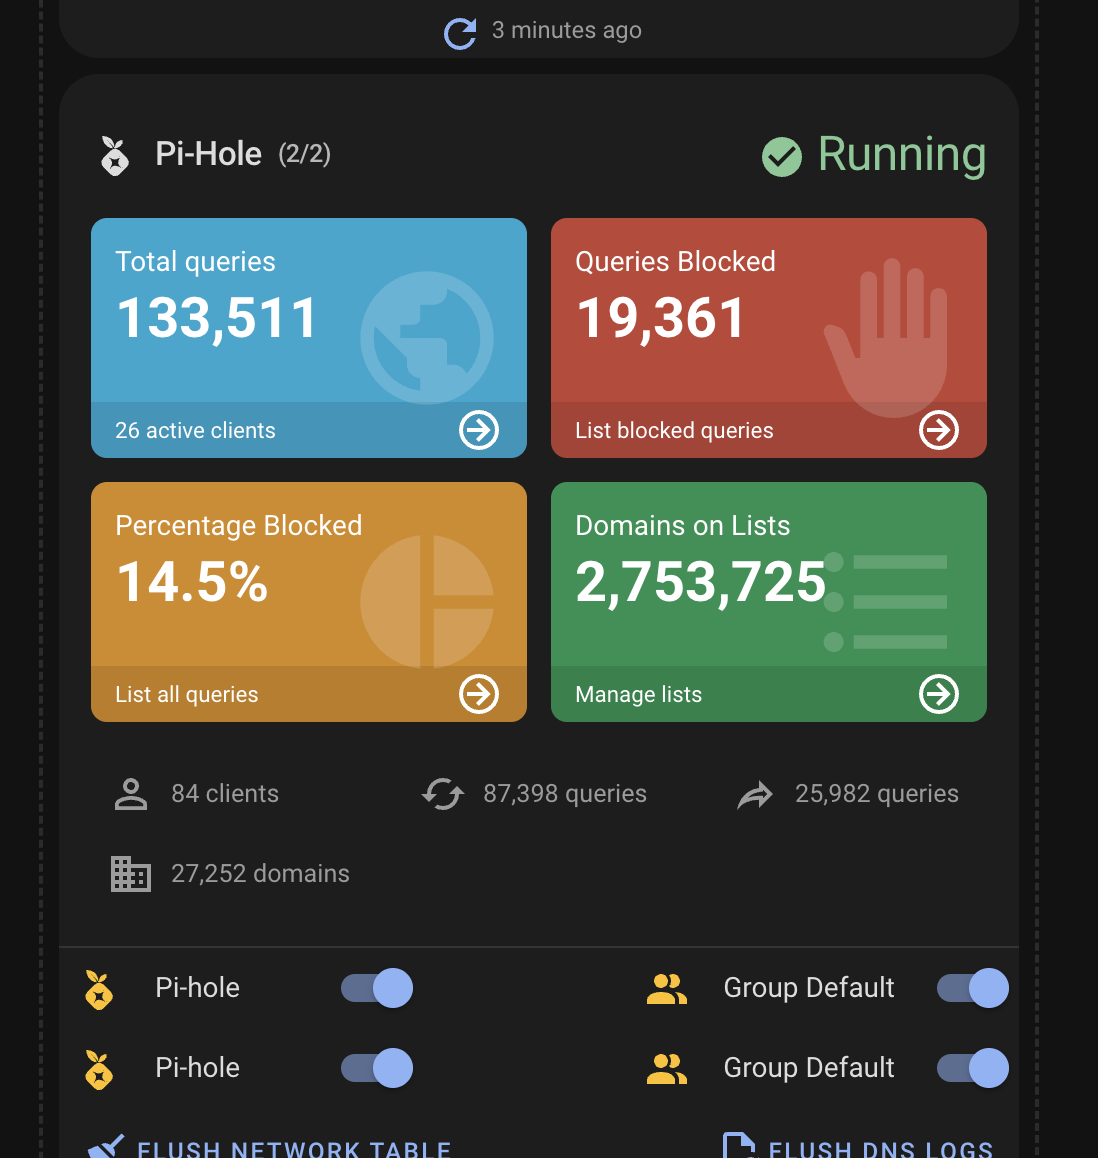
Header status reflects the overall state:
- Running when all instances are active
- Partial when some instances are active and some are inactive (shows count like
2/3)
Example (partial):
Example (all running):
[!NOTE] With multiple Pi-hole instances, dashboard statistics are combined; switches from all instances appear in one list; header status reflects the combined state; some sections (e.g. additional metrics, system chart) may follow the first configured instance see Features.