Configuration options
| Option | Type | Description |
|---|---|---|
device_id |
string | Required. Home Assistant device id for the Litter-Robot. |
title |
string | Optional. Overrides the card heading; defaults to the device name. |
cleaning_entity |
string | Optional. Entity (input_boolean, alert, binary_sensor, or switch) whose active state shows a "needs cleaning" header badge + card glow. See Cleaning reminder. |
color |
string | Optional. Robot artwork color: white (default) or black. |
mini |
boolean | Optional. Compact layout: title row and litter/waste gauges only. Hides the artwork, quick actions, controls menu, graphs, and footer. See Mini layout below. |
footer |
string[] | Optional. Footer metrics in display order. See footer items below. |
features |
string[] | Optional. Feature flags. percentage — show fill % on litter and waste gauges. illustrated — robot illustration whose litter/waste zones fill in proportion to their level, instead of the marketing image and bars. See Feature flags. |
chonk |
object | Optional. Pet weight graph options (history or statistics graph). See Pet weight graph below. |
visits |
object | Optional. Pet visits graph options (daily litter box visits per cat). See Pet visits graph below. |
Mini layout
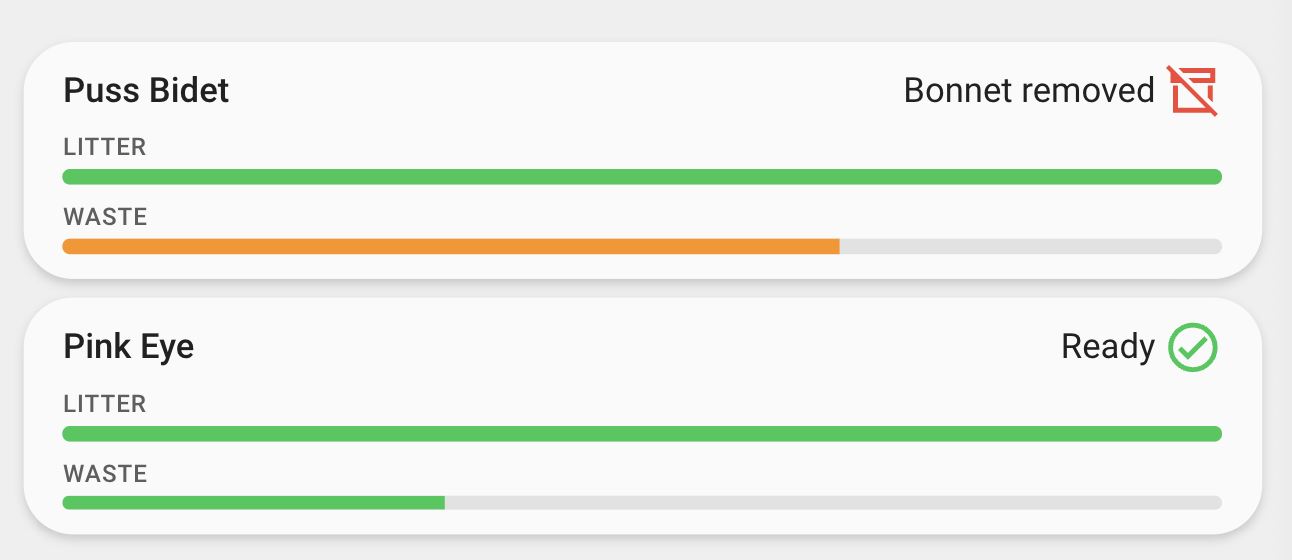
Set mini: true for a compact, low-profile card built for wall-mount and small dashboards:
The mini card keeps the title row — device name, status text and icon, plus the cleaning and LitterHopper badges when configured — and the litter and waste gauges, which stretch to the full card width.
Omitted in mini: the robot artwork, quick actions, controls menu, both pet graphs, and the footer. Because those do nothing here, the visual editor hides their options while mini is on.
Still supported in mini: title, cleaning_entity, and the percentage / illustrated feature flags. The cycling and needs-cleaning card glows work as usual.
Footer items
Values for footer:
total_cyclesstatus_changedlast_seenpet_weightstatuslitter_levelwaste_drawerhopper_statushopper_connected
hopper_status and hopper_connected apply only on LR4 with a LitterHopper attached.
More detail in Footer configuration.
Pet weight graph
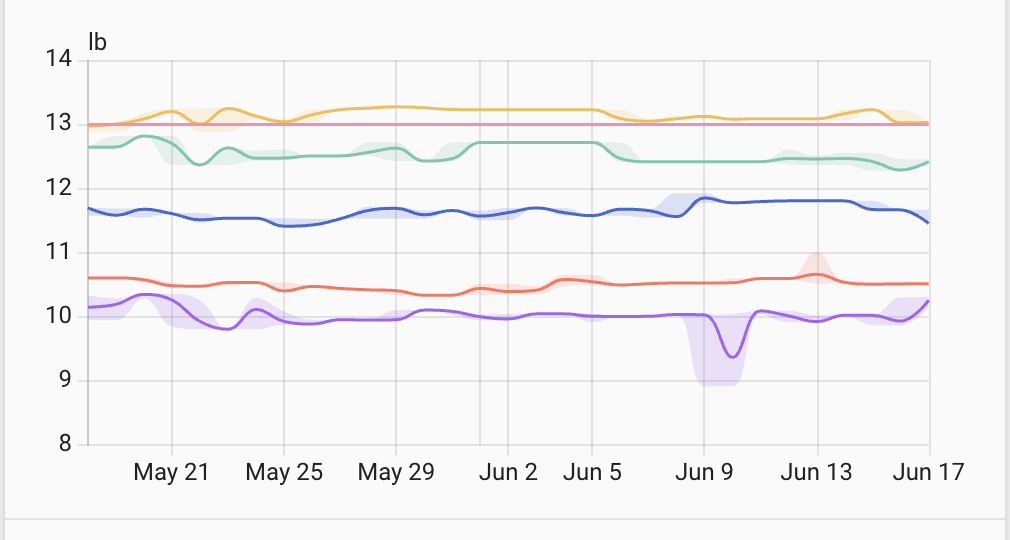
The card shows a pet weight graph below the gauges. It can render either Home Assistant's built-in history graph (live recorder data) or its statistics graph (long-term statistics — mean/min/max aggregated over days). Pick the mode with graph_type. When it is omitted, the card uses the statistics graph (mean/min/max, daily) — both from the dashboard UI and from hand-written YAML.
Configure it with the chonk object:
| Key | Type | Graph | Description |
|---|---|---|---|
kitties |
string[] | both | Optional. Weight sensor entity ids to plot. When omitted, the card auto-detects per-cat weight sensors from the integration. |
graph_type |
string | both | Optional. statistics (default) or history. |
hide |
boolean | both | Optional. Hide the weight graph entirely. Defaults to false. |
collapsed |
boolean | both | Optional. Start the titled collapsible section closed. Defaults to false (starts open). |
hide_names |
boolean | both | Optional. History graph: hide entity names. Statistics graph: hide the legend. Defaults to false. |
hours_to_show |
number | history | Optional. Hours of history to show. Defaults to 168 (7 days). |
days_to_show |
number | statistics | Optional. Days of statistics to show. Defaults to 30. |
period |
string | statistics | Optional. Aggregation period: auto (default), 5minute, hour, day, week, or month. |
stat_types |
string[] | statistics | Optional. Statistic series to plot: mean (default), min, max, state, change, sum. |
chart_type |
string | statistics | Optional. Chart style: line (default), line-stack, bar, or bar-stack. |
History graph
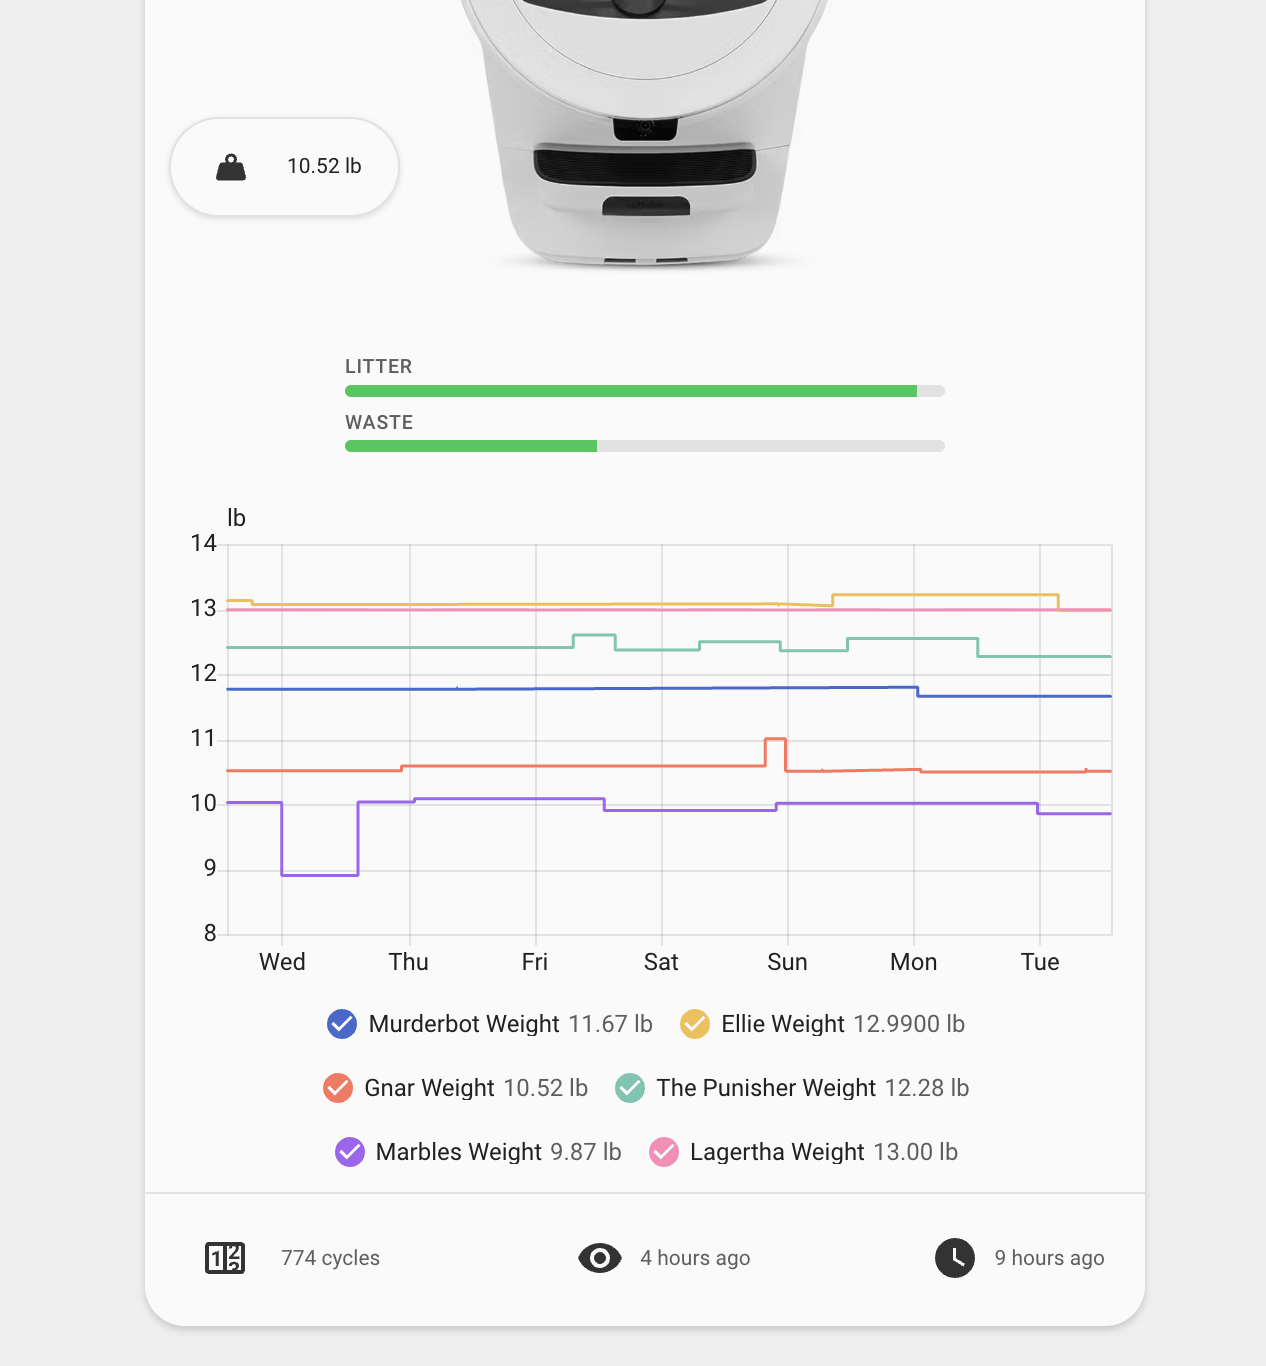
type: custom:whisker-card
device_id: YOUR_DEVICE_ID
chonk:
  graph_type: history
  kitties:
    - sensor.kitty_weight
    - sensor.mittens_weight
  hours_to_show: 168
Statistics graph
Plots long-term statistics, which is ideal for spotting weight trends over weeks or months.
type: custom:whisker-card
device_id: YOUR_DEVICE_ID
chonk:
  graph_type: statistics
  kitties:
    - sensor.kitty_weight
    - sensor.mittens_weight
  days_to_show: 30
  period: day
  stat_types:
    - mean
    - max
    - min
  chart_type: line
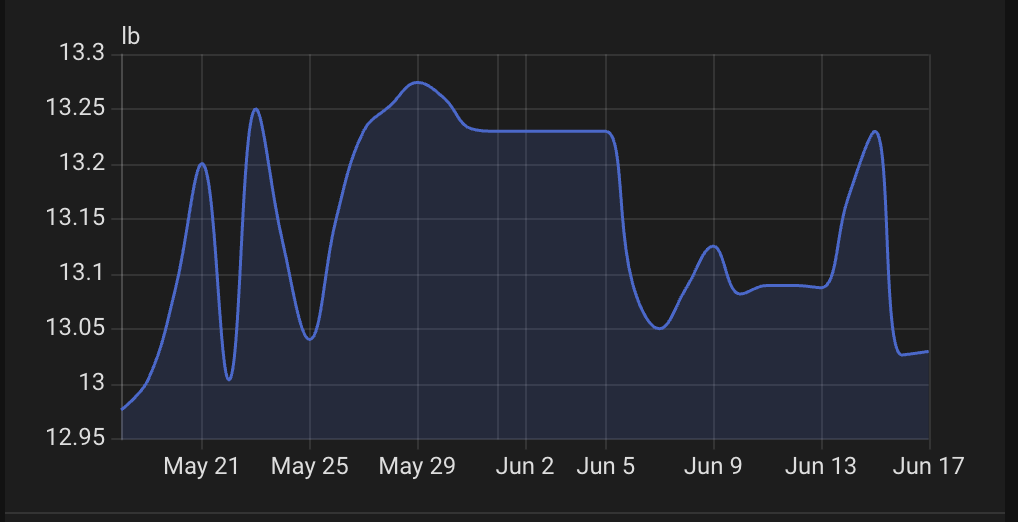
Use a stacked chart (line-stack or bar-stack) to compare combined weight across cats:
type: custom:whisker-card
device_id: YOUR_DEVICE_ID
chonk:
  graph_type: statistics
  chart_type: line-stack
  stat_types:
    - mean
Pet visits graph
The card also shows a visits graph below the weight graph, plotting how many times each cat used the box. It's built from the integration's per-pet visits_today sensors, which are auto-detected the same way weight sensors are.
That sensor is a running daily total that resets at midnight, so the defaults differ from the weight graph: a statistics graph plotting change (visits per period) as stacked bars over a daily period. Stacking gives you one bar per day showing the household's total visits, split by cat. Averages and min/max don't mean anything for a resetting counter, so the editor only offers change and sum.
Configure it with the visits object:
| Key | Type | Graph | Description |
|---|---|---|---|
kitties |
string[] | both | Optional. visits_today sensor entity ids to plot. When omitted, the card auto-detects them from the integration. |
graph_type |
string | both | Optional. statistics (default) or history. |
hide |
boolean | both | Optional. Hide the visits graph entirely. Defaults to false. |
collapsed |
boolean | both | Optional. Start the titled collapsible section closed. Defaults to false (starts open). |
hide_names |
boolean | both | Optional. History graph: hide entity names. Statistics graph: hide the legend. Defaults to false. |
hours_to_show |
number | history | Optional. Hours of history to show. Defaults to 168 (7 days). |
days_to_show |
number | statistics | Optional. Days of statistics to show. Defaults to 30. |
period |
string | statistics | Optional. Aggregation period: day (default), auto, 5minute, hour, week, or month. |
stat_types |
string[] | statistics | Optional. Statistic series to plot: change (default) or sum. |
chart_type |
string | statistics | Optional. Chart style: bar-stack (default), bar, line, or line-stack. |
Nothing is required — with the integration set up, the graph appears on its own:
Pick specific cats and a shorter window:
type: custom:whisker-card
device_id: YOUR_DEVICE_ID
visits:
kitties:
- sensor.ellie_visits_today
- sensor.mittens_visits_today
days_to_show: 14
chart_type: bar
Use plain bar (as above) to give each cat its own bar instead of stacking them.
Hide it entirely:
Collapsible sections
Each graph sits in its own titled section ("Pet weight", "Pet visits") that you can click to open and close. Set collapsed: true to have a section start closed — useful when you want a graph available without making the card tall:
Expanding a section lasts for as long as the dashboard stays loaded; it returns to closed on the next refresh. Use hide instead of collapsed if you never want the graph shown at all.